

Whether you're studying for your Statistics finals, or are a newcomer to the subject and just need some additional help with your coursework, these Stats exam practice questions are sure to help.
Most software packages, like Stata and R, require little to no computation on the part of the statistician, however, it is still important to understand the arithmetic at the root of the analytic methods employed.


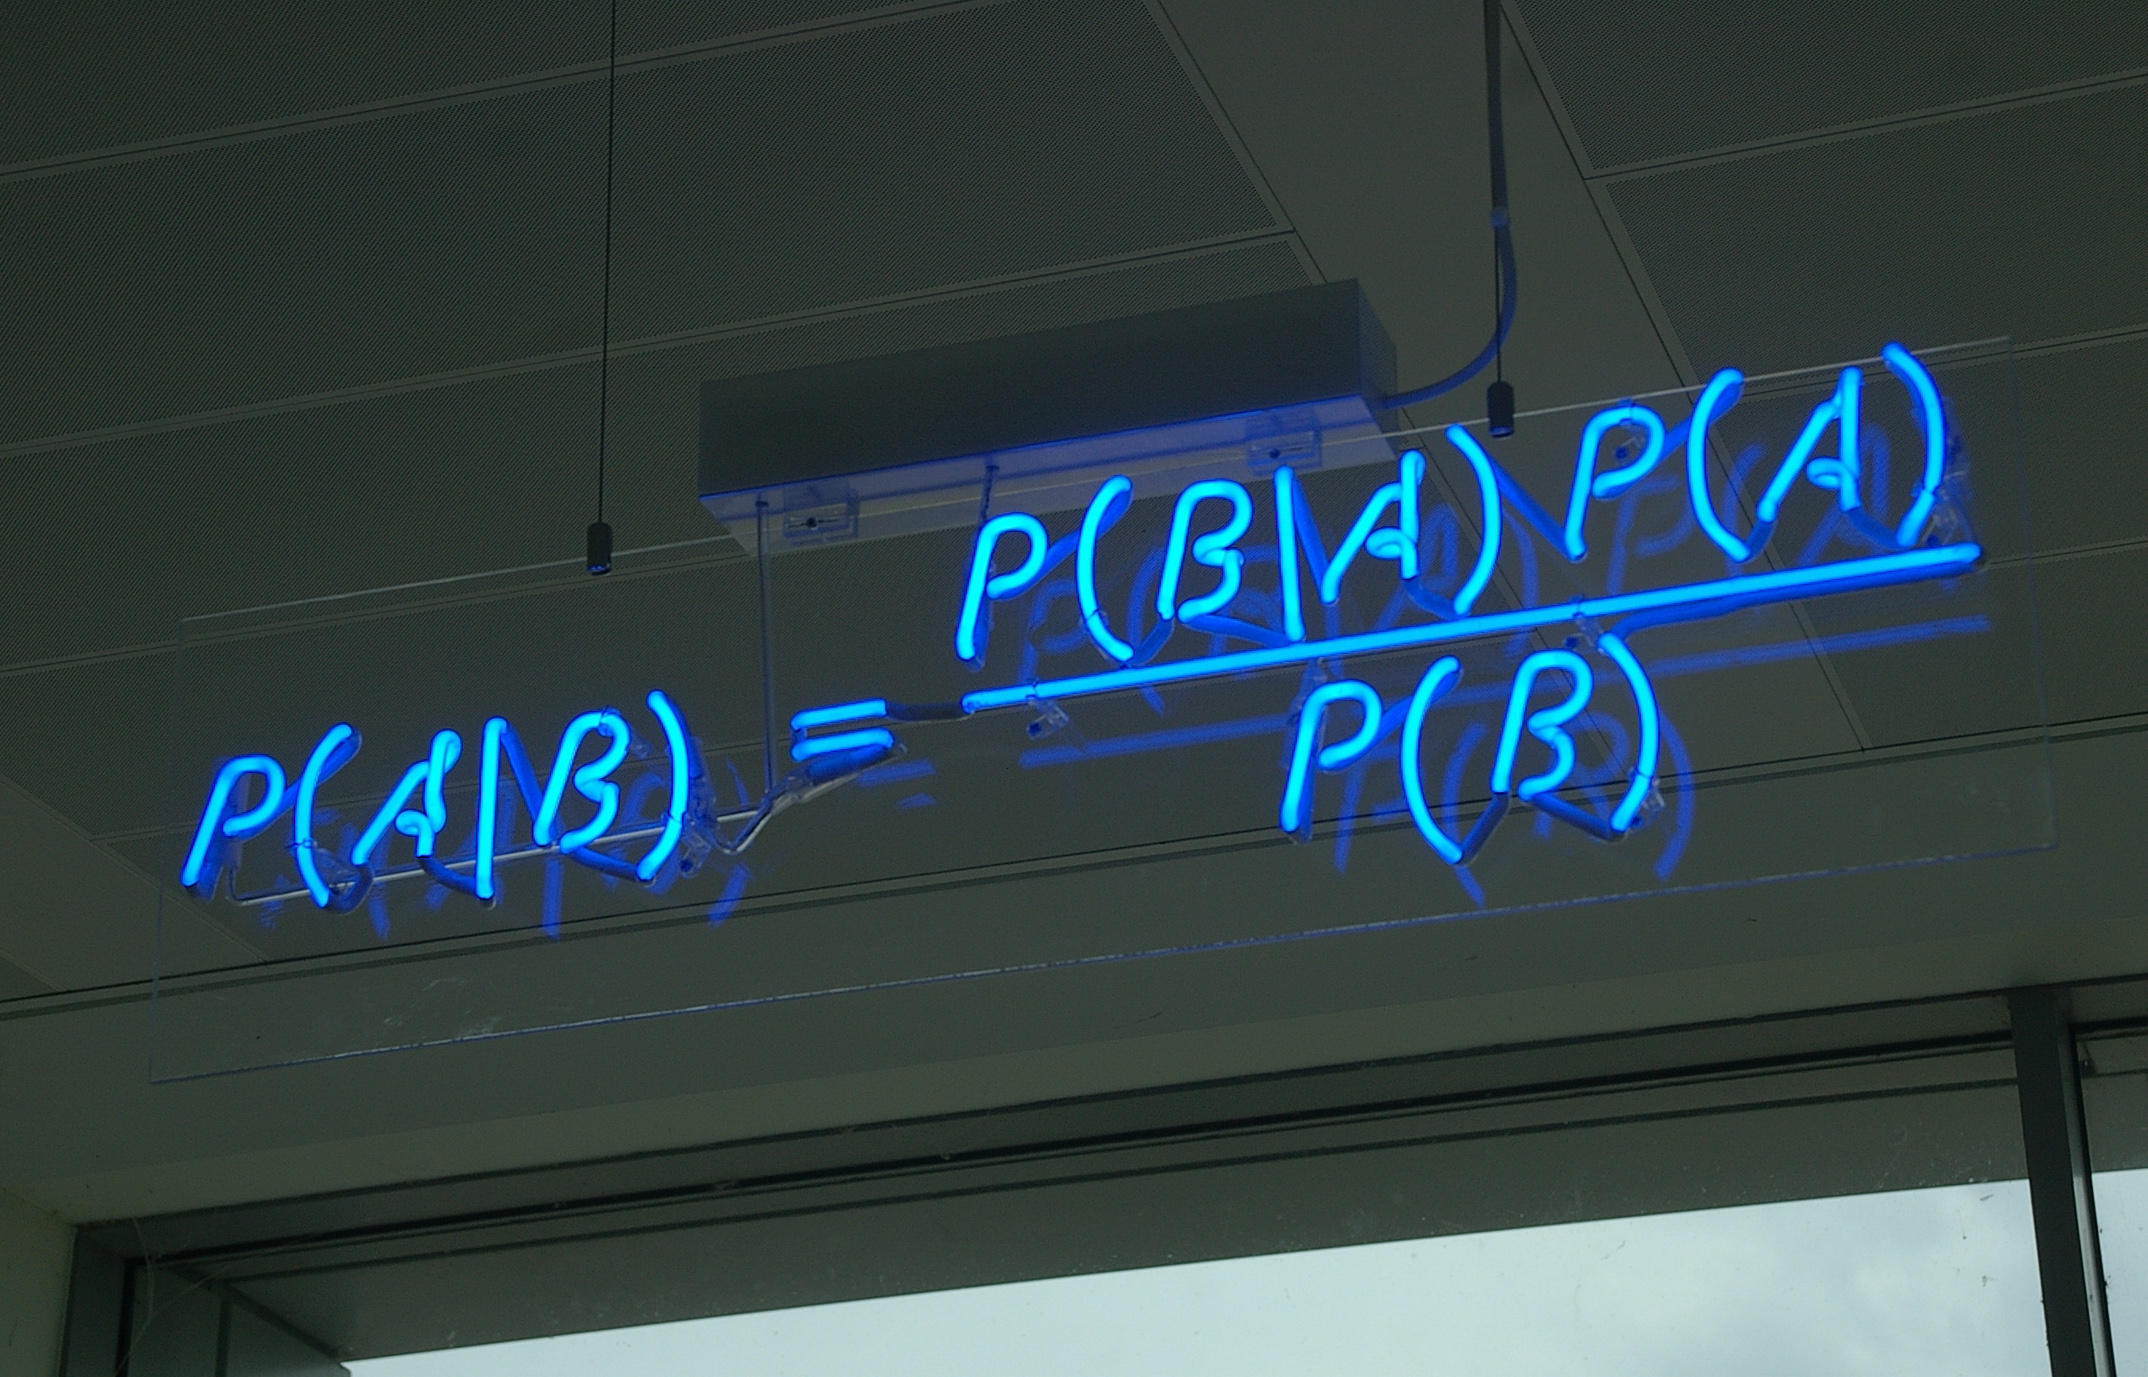
Bayesian Inference and Bayes' Theorem
You will be exposed to Bayesian statistics in your Stats 101 course, so you must be able to draw conclusions using Bayesian inference.
So, what exactly is Bayes' theorem, and how does it help us analyse data?
Bayes' theorem allows us to use existing knowledge or beliefs (referred to as the prior) to calculate the likelihood or probability of a related event occuring.
For example, if you would like to determine the probability of finding customers willing to buy hot chocolate from your hot chocolate stand on a cold, rainy day, using Bayes’ theorem, you will examine previously gathered, empirical data about the likelihood of selling hot chocolate on any other type of day.
Some Definitions to Get You Started:
Statistical inference is the process of deducing properties or drawing conclusions about a population based on data.
Bayesian inference is a method of statistical inference in which Bayes' theorem is used to update probabilities as more information on the population becomes available.
During your studies, you will often encounter statistics problems based on this theorem, so it is important to remember the principles. In this article we will work through three examples which are based on Bayes' theorem.
Find a suitable data science online courses on Superprof.
Basic Statistics Calculations
You will need to understand elementary statistics in order to do the practice problems presented in this article. If you are preparing for a statistics exam, you will already have taken an Introduction to Probability course and understand the importance of conditional probability in performing calculations in statistics. Probability and statistics go hand and hand, which is why it’s important for you to have a good grasp on probability before working through these practice exam questions.
You should also know the meanings of the following terms and concepts:
- Sample Mean, Median and Mode
- Standard Normal Distribution
- Central Limit Theory
- Central Tendency
Question 1: Build a Box Plot Based on a Stem-and-Leaf Plot
Both box plots, also called box-and-whisker plots, and stem-and-leaf plots display the basic statistics of data sets in visual format.
The difference is that a box plot is made up of rectangles or "boxes" that are positioned according to the median and the quartiles of the data set, while a stem-and-leaf plot reflects all the data points in the set in a tabular form.
In order for you to build a box plot, it is important to understand what each point on the plot represents.
- The median is the middle value.
- It does not explain how the data on either side of it is dispersed.
- The quartile breaks the data set down into four groups, to measure the spread of values above and below the median. 1, 2, 3, and 4 represent the four quartiles of your data set, and 25% of the total observations are contained in each quartile.
- The first or lower quartile, Q1, is the number that falls in the middle of the median and the smallest value of your data set. The lowest 25% of the values in the data set is contained in this group, i.e. the smallest value up to Q1.
- Q2, the second quartile, is also the median, and includes the data values from Q1 to the median, i.e. between 25.1% and 50% of your data.
- The third or upper quartile, Q3, is the data point in the middle of the median and the highest value of your data set. This group includes data above the median to Q3, i.e. 50.1% to 75%.
- Q4, the fourth quartile, represents the maximum. This group contains the highest 25% of the values in the data set, i.e. from Q3 to the highest data point in your data set.
Your data distribution is then compared to a normal distribution:
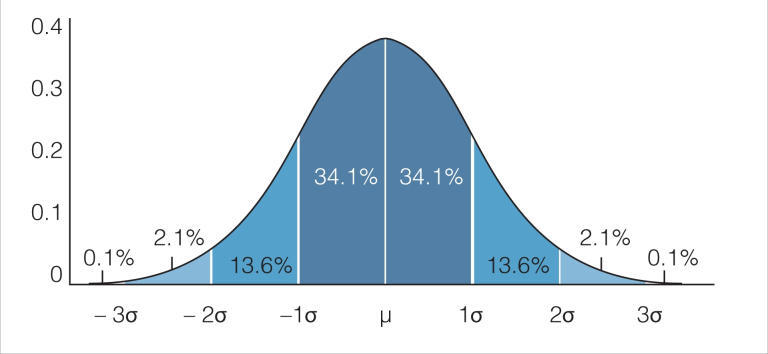
The properties of a normal distribution, as shown in the above image, are as follows:
- The distribution is symmetric. Therefore the median and the mean, represented by the Greek letter μ, are the same value – directly in the middle of the distribution.
- The standard deviation, represented by the Greek letter σ, is the distance from the middle to the saddle point (where the curve starts changing shape).
- Approxiamtely, 68% of the data values lie within 1 standard deviation of the mean, around 95% lie within 2 standard deviations, and most of the values lie within 3 standard deviations of the mean.
Any data points beyond the minimum and maximum values are considered to be outliers.
An outlier is a data point that differs significantly from other observations in the sample population.
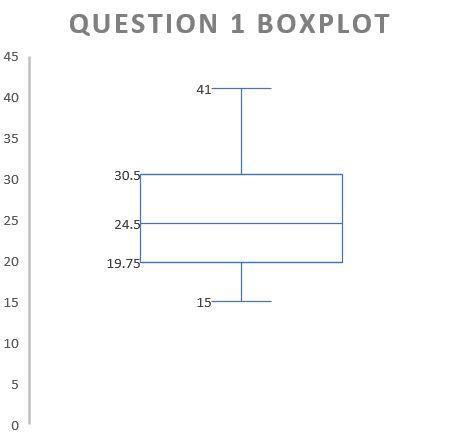
With this information known, we can create a box plot, like the following:
Question 2: Calculate and Interpret the Correlation Coefficient
This question builds on the last section, and focuses on how particular variables within your data set relate to one another.
It is useful to have a good understanding of how to interpret the relationships between variables, as this knowledge can be applied regardless of the types of data you are analysing.
Two important concepts you will encounter are correlation and covariance, which are measures used to establish how closely variables relate to each other.
- Correlation measures the strength of the linear relationship between two variables. The correlation coefficient is used to assign a value to the relationship between variables under invetsigation. The correlation coefficient takes a value between +1 and −1 (inclusive), where:
- 0 means there is no relationship
- -1 means that there is a perfect negative correlation
- 1 means that there is a perfect positive correlation.
- Covariance evaluates in which direction two variables change together. Covariance does not indicate the dependancy between two variables, but measures their total variation from their expected values. We therefore use this measure to establish whether variables show a direct or an inverse relationship.
For example, if you have a data set relating to healthy children in primary school, height and weight are likely to have a high correlation.However, variables such as height and favourite colour are unlikely to have a high correlation.
In regression analysis, the computation and interpretation of the correlation coefficient is extremely important.
The most common correlation table is called the Product Pearson Correlation Table, and it looks like this:
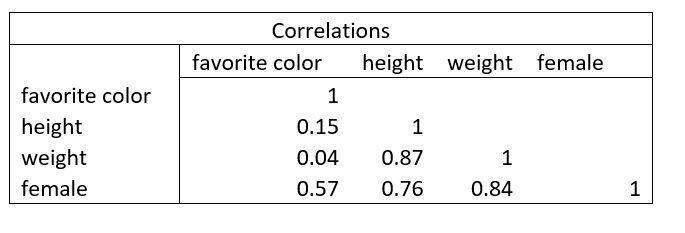
The numbers in the table represent the correlation coefficient, which is calculated using the standard deviation and the covariance of the sample.
The standard deviation, represented by σ (the greek letter sigma) is a measure of the dispersion of your data around the mean of the data set. Determining standard deviation relies on the following simple calculation: the square root of the variance.
Note: Variance measures how one variable varies inside of a data set, and is not to be confused with covariance.
There are three basic rules for interpreting the correlation coefficient:
- The diagonal represents the correlation between the the variable under investigation and itself. This should always be 100% or 1, and the numbers along the diagonal should therefore always be one.
- A correlation higher than 50% should be considered a high correlation, whilst a correlation below 50% should be considered a weak correlation. In this example, favourite colour only has a 4% correlation with weight, whilst weight and height have a strong correlation of almost 90%.
- Weak correlations may still be of interest to you. In this example, favourite colour has a 57% correlation with gender. Although this isn't an exceptionally strong correlation relative to the table, it does hint towards gender differences that may be worthwhile investigating.
Question 3: Interpreting Statistical Tests
Statistics relies heavily on the information the statistician has already learned. Therefore, it is important for any student to master the basics of statistics in order to better understand calculations in statistics and to practise statistical tests.
Depending on the type of statistics test you are performing, the method of interpretation will be differ. Two of the most common tests you will learn at the beginning of your statistics career are:
- T-Test
- Chi Square Test
Both the chi square test and the t-test involve hypothesis testing, or testing whether variables within the data set are related or not.
A t-test compares the means of two variables, and provides insight into how these variables are related. For example, when comparing a new medication and a placebo, a t-test can be used to analyse the health scores of two groups of patients.
A chi-square test can be used either to determine whether the distribution of the sample data matches that of the population (a chi-square goodness of fit test), or whether two variables in a contingency table are related to one another (a chi-square test for independence).
There are great resources available to help you decide which statistical tests you should use to analyse your data.
Get Extra Help With Statistics
If you are struggling with statistics, there are, thankfully, many resources that are easily available. Not only can you refer to textbooks and other reading material, but you can find helpful tips and private tutorials on online platforms such as Khan Academy and Superprof. For extra statistics help, the Massachusetts Institute of Technology offers fantastic resources via its MIT OpenCourseWare platform.
YouTube also offers some good data science made simple tutorials, if you're in need of further explanations. The fastest way to find the help you need would be to use the specific statistics concepts you are struggling with as the keywords of your search.
Don't rule out asking for some one-on-one explanations from your statistics lecturer, who may be only too happy to assist a student who demonstrates a keen interest in succeeding in the subject.
Everyone learns in a different way, and at a different pace. Remember this as you continue on your statistics journey
Discover different data science courses here on Superprof.
Summarise with AI:
Enjoyed this article? Leave a rating!


